INTERVIEW
Interviewees and Process followed
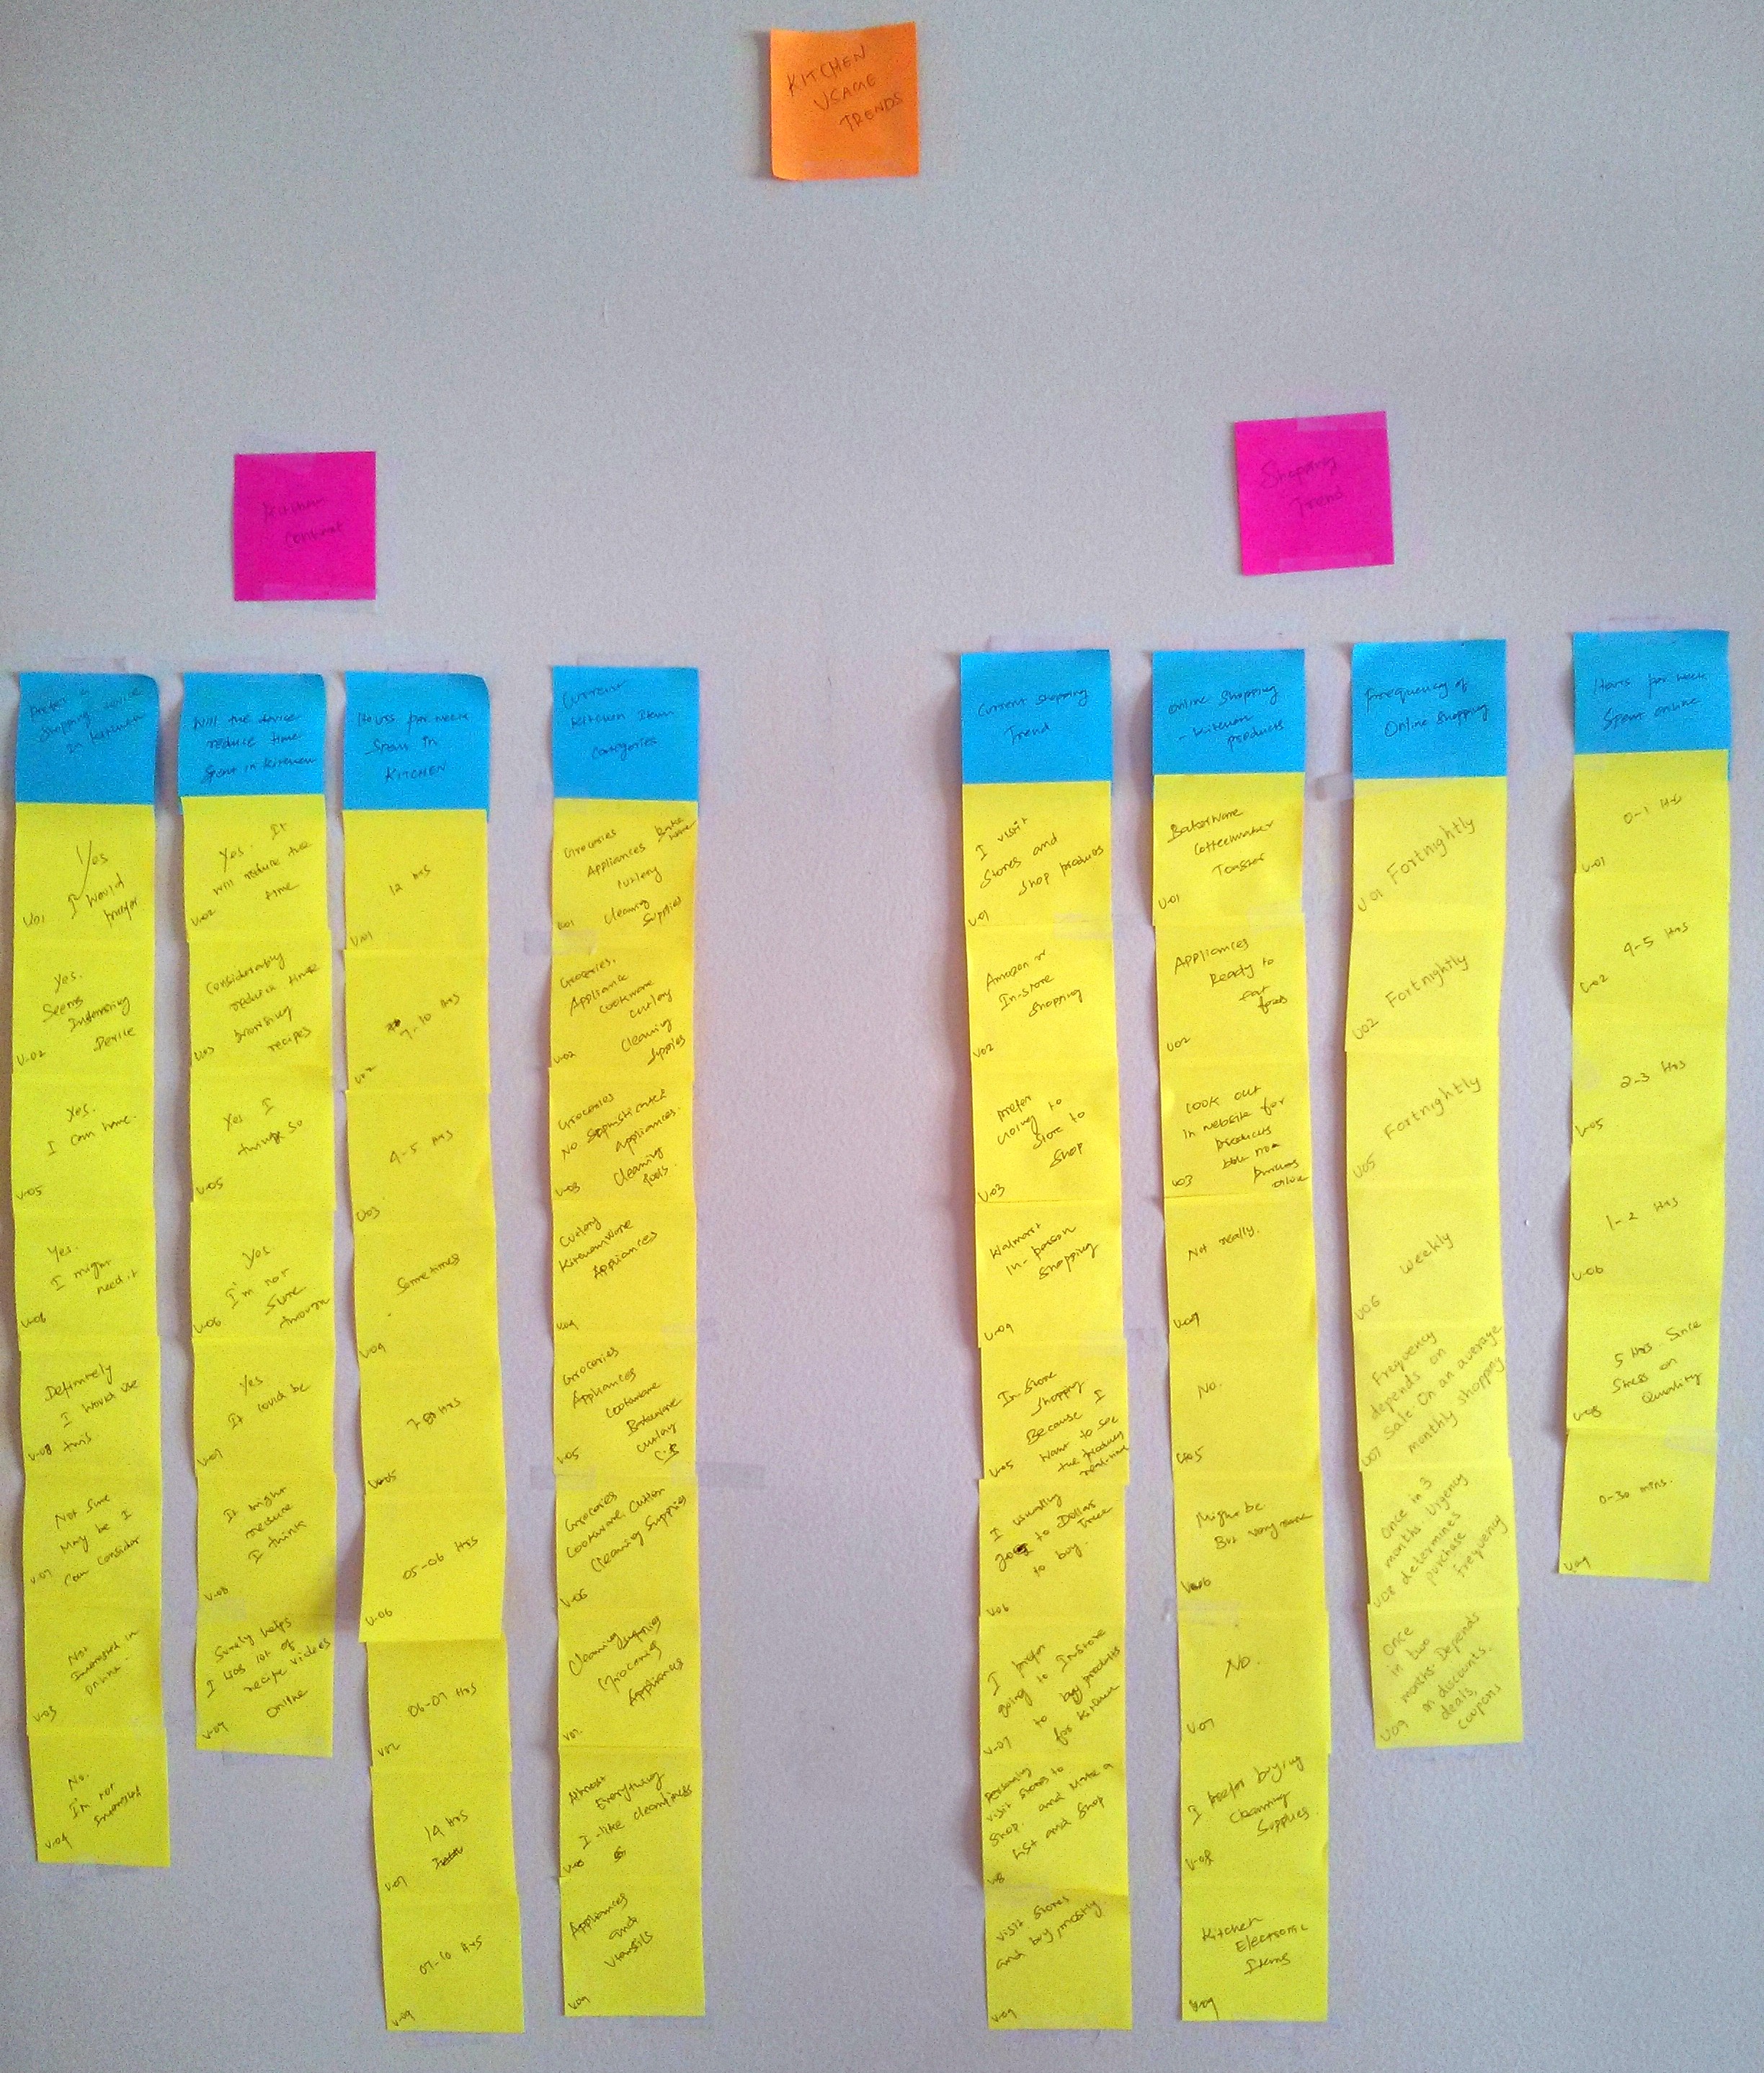
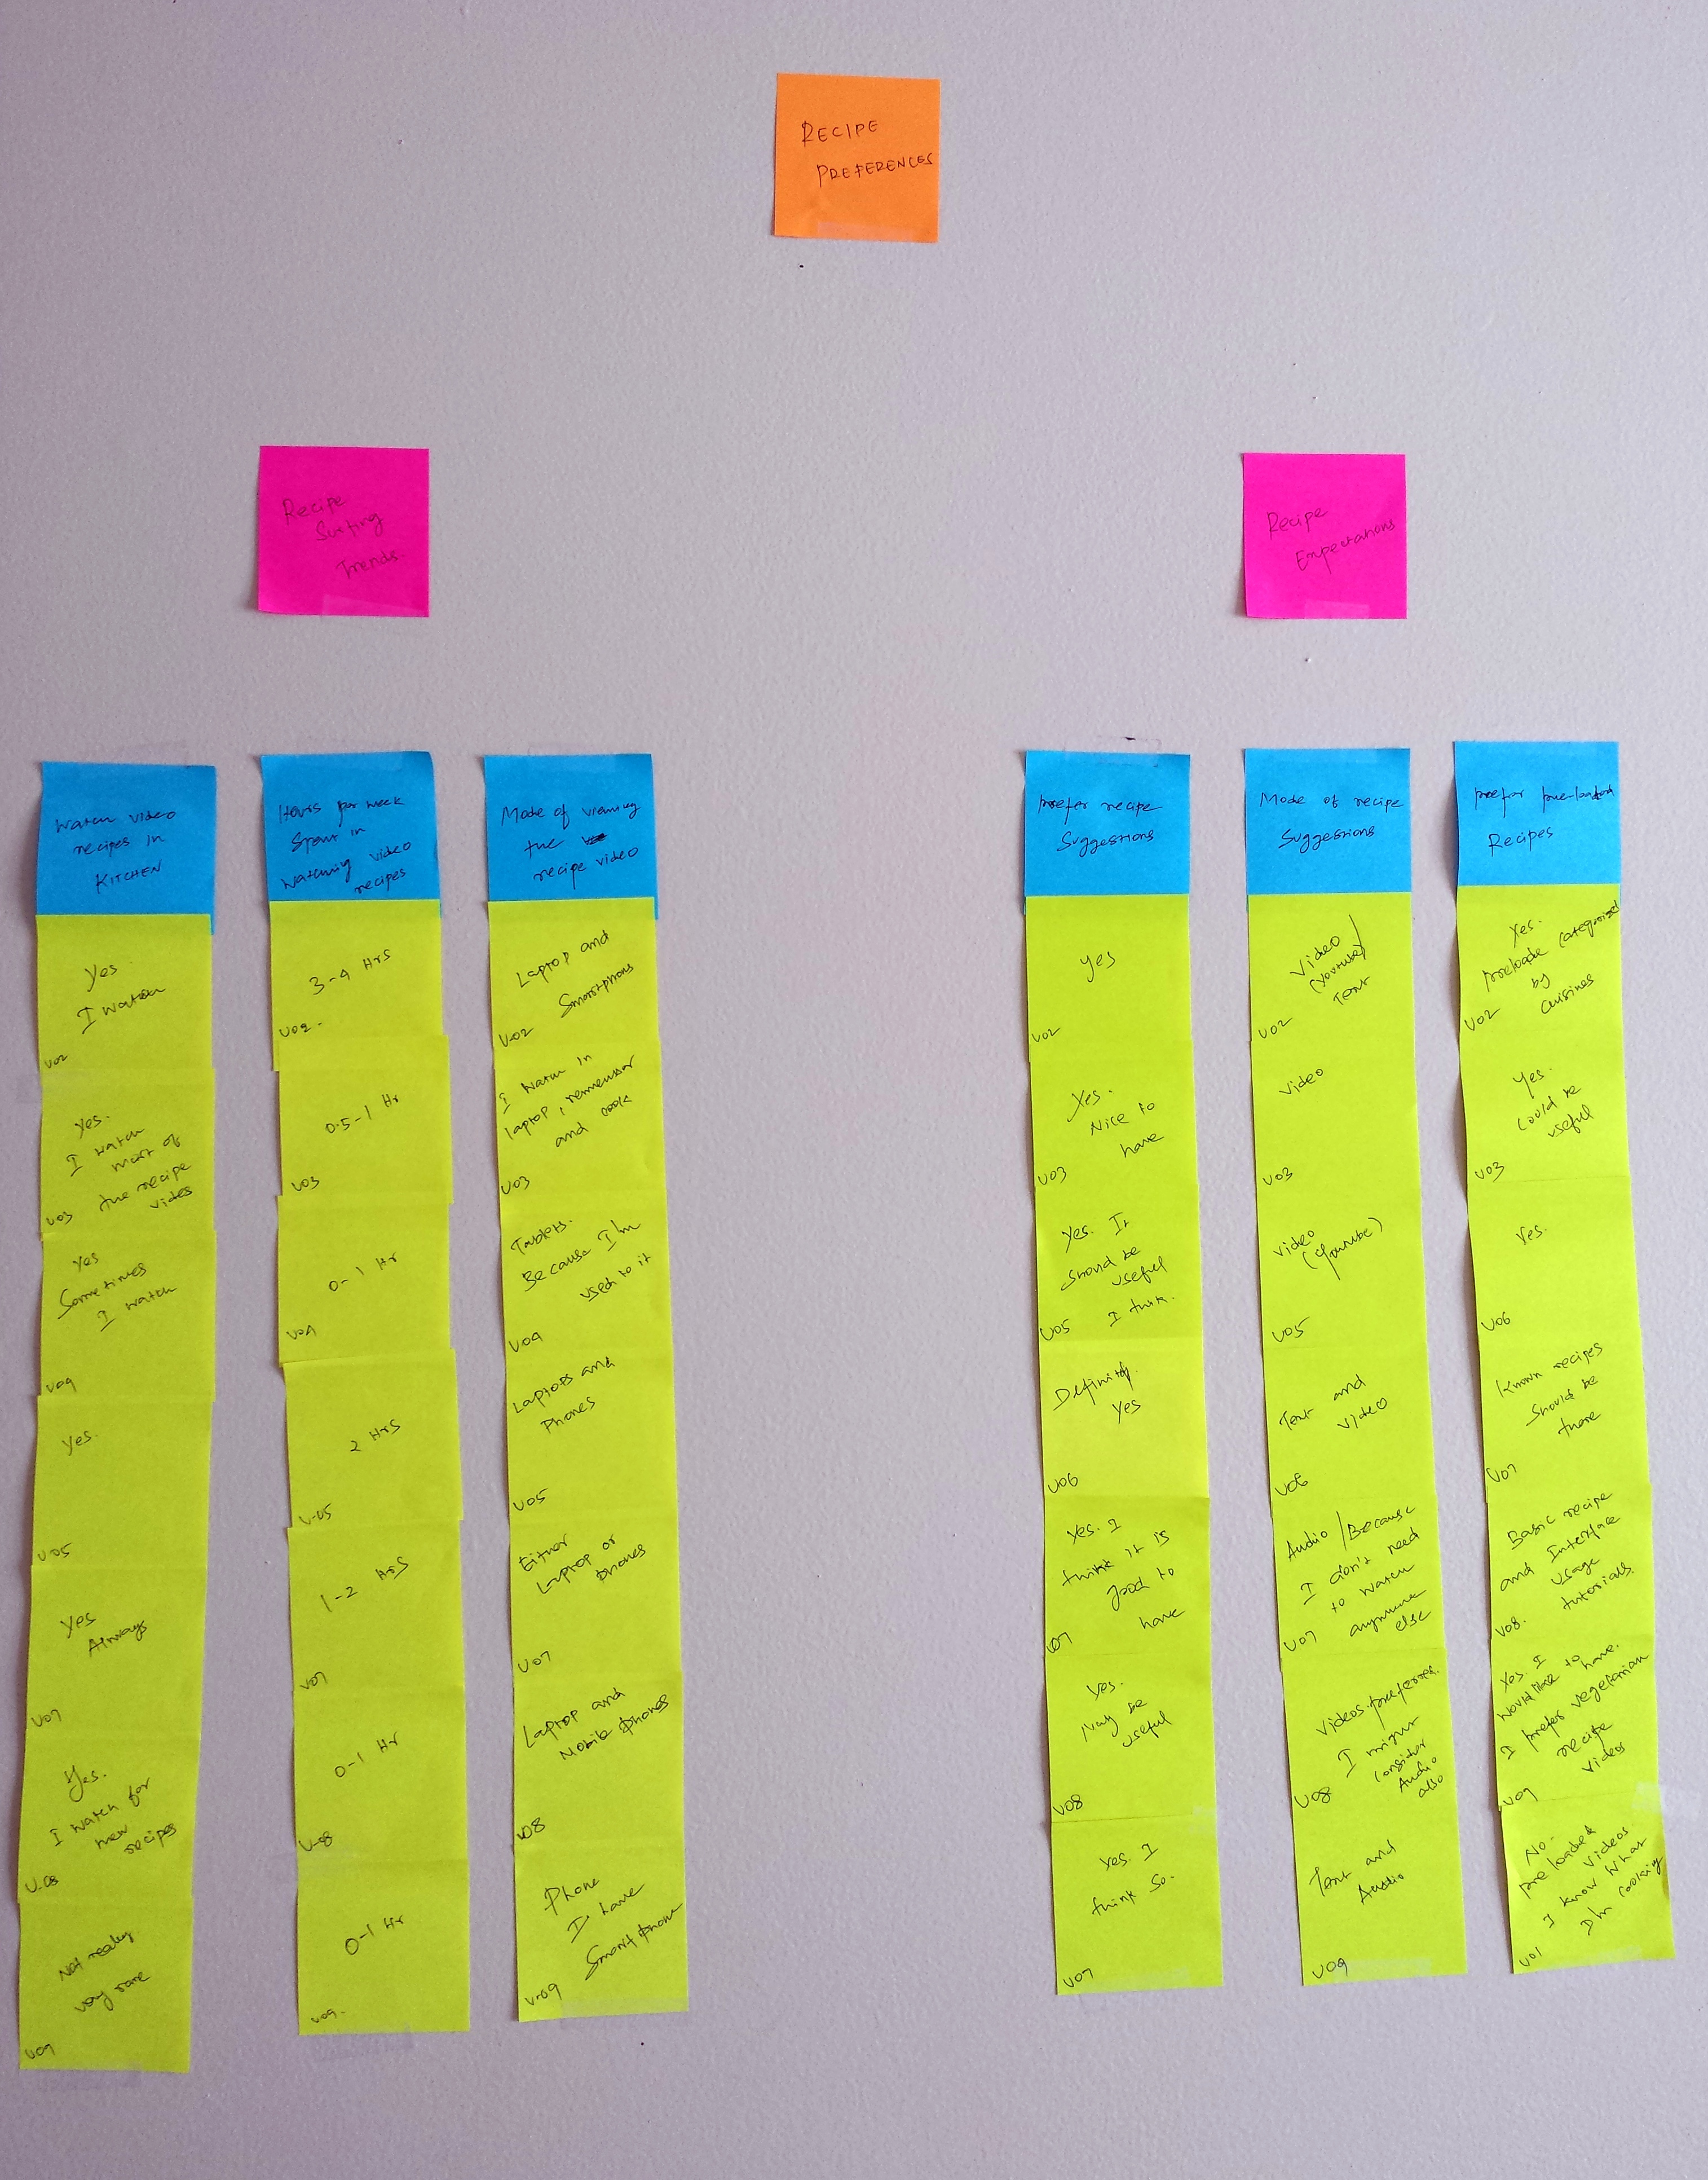
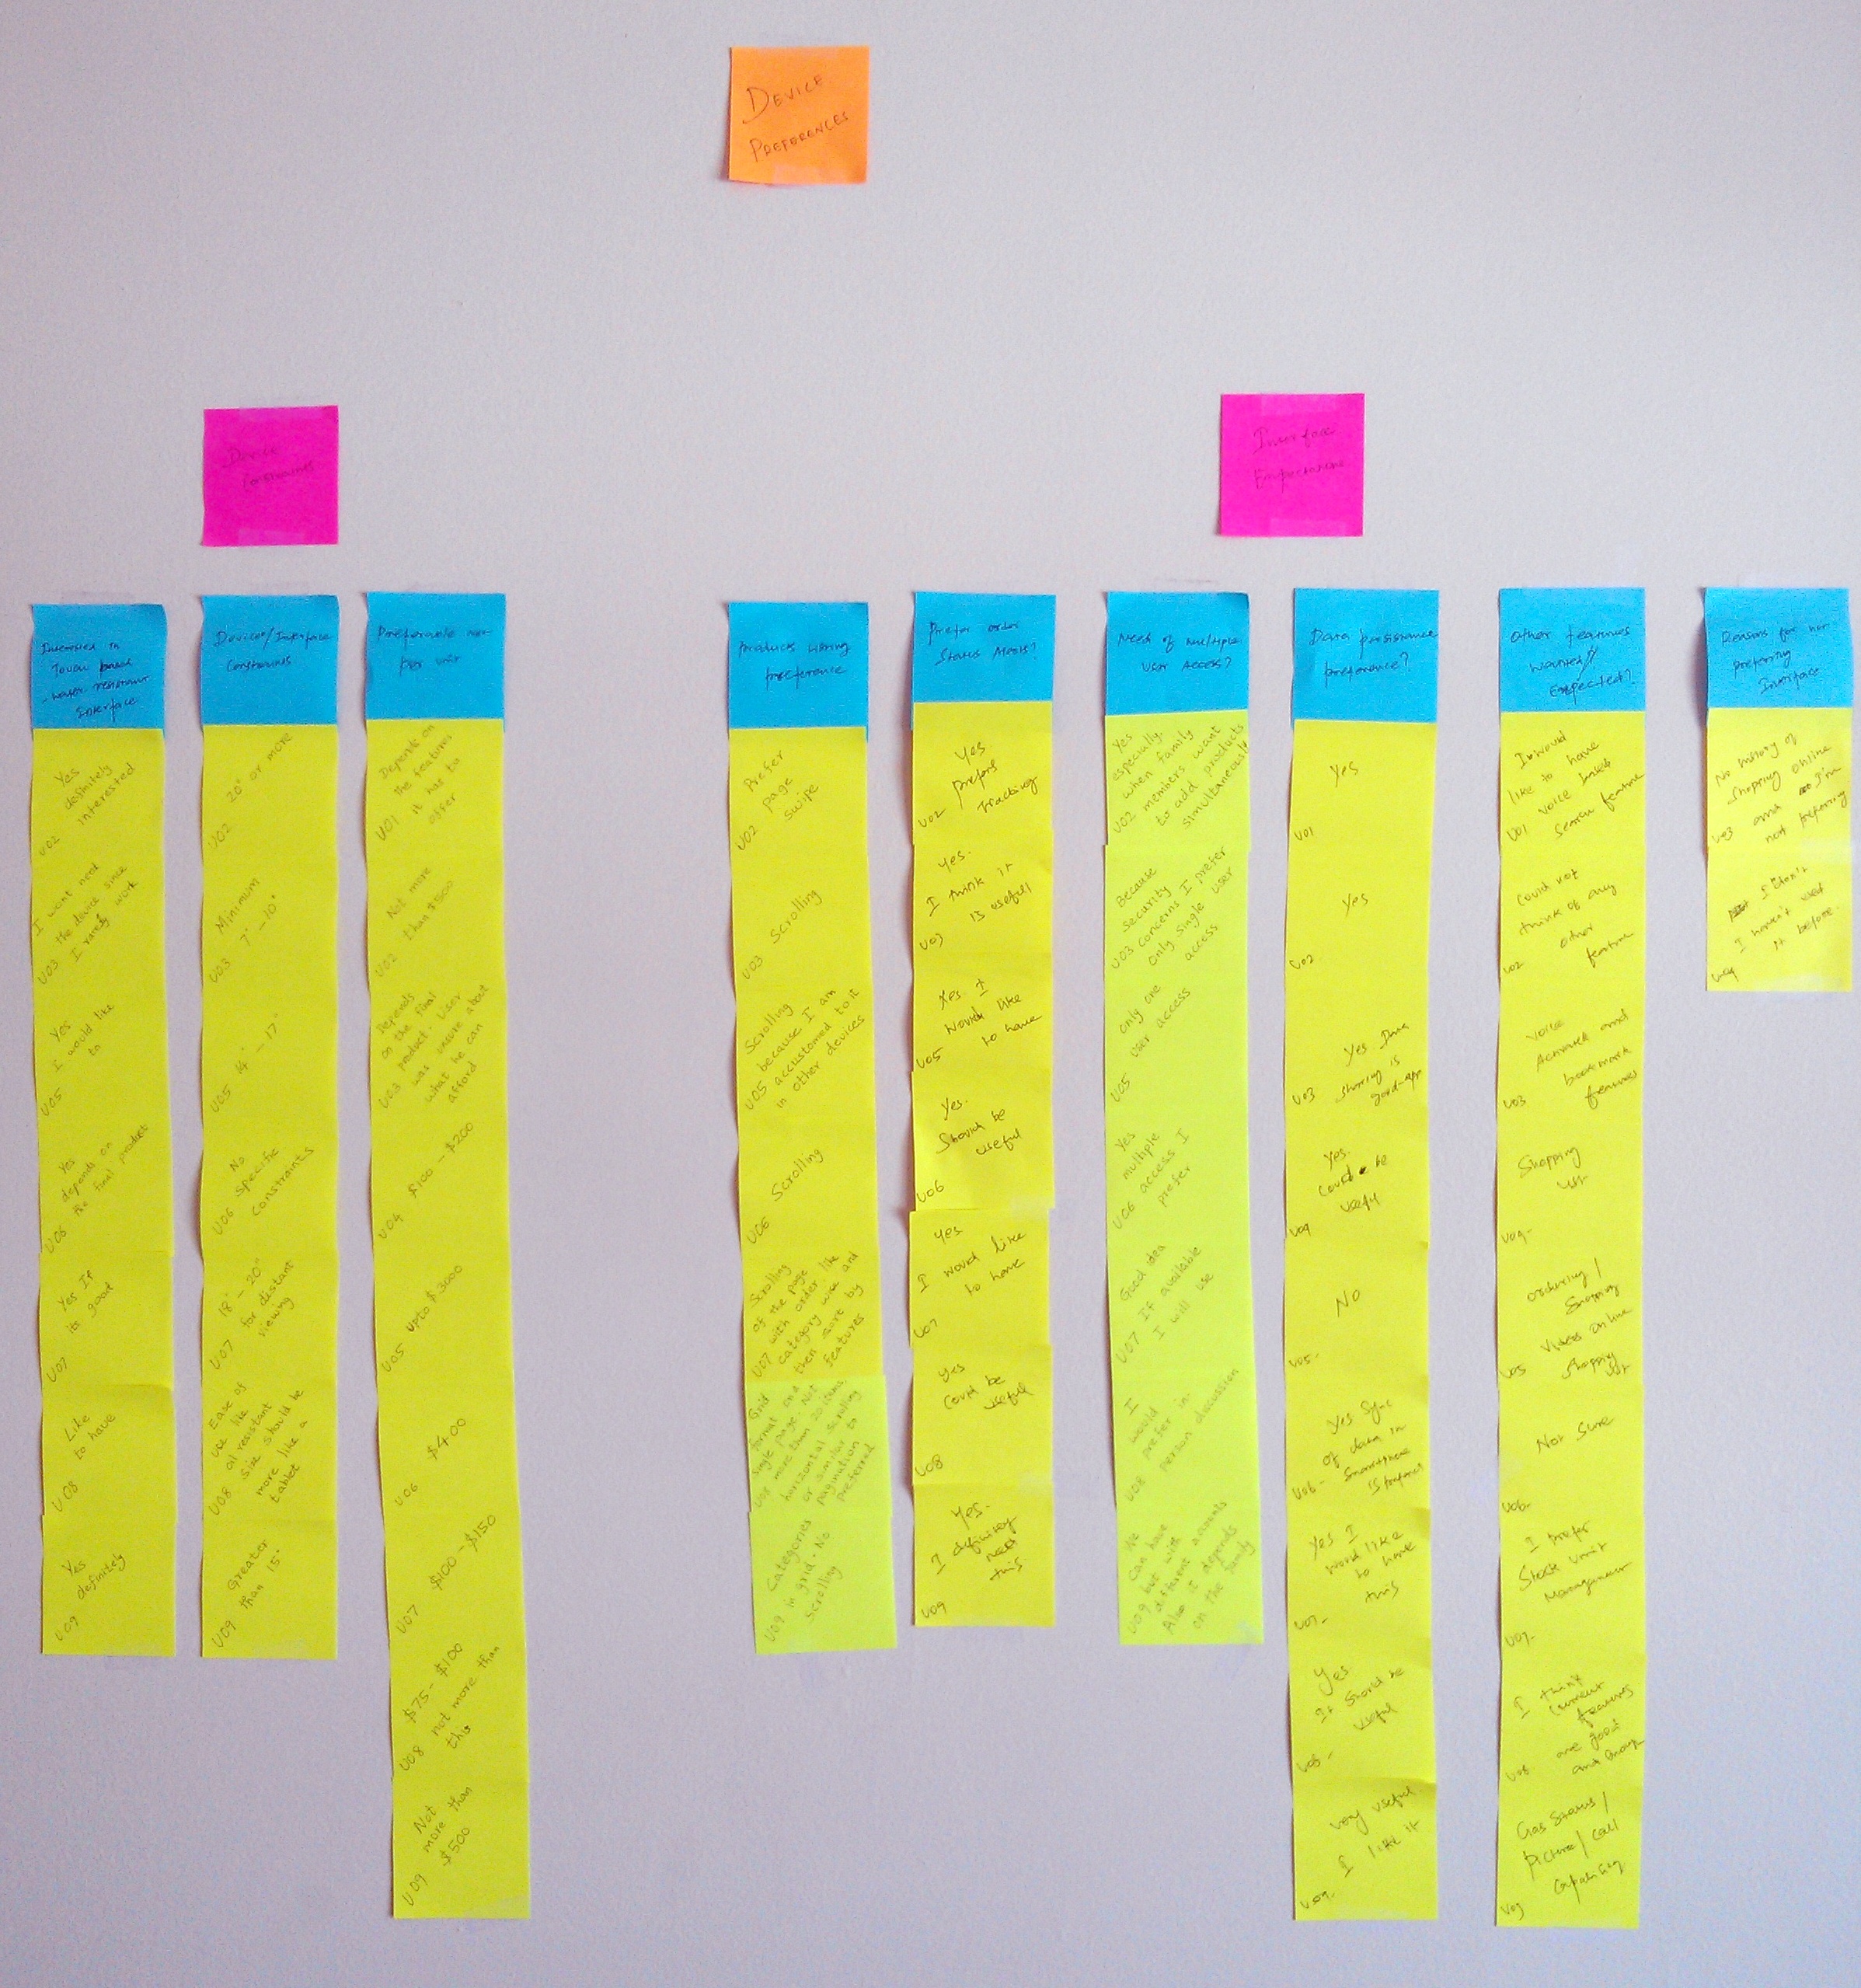
To learn more about people’s kitchen habits and related shopping experience, we decided to interview different types of people using contextual enquiry. Before we selected our potential contextual enquiry candidates, we grouped the kitchen table top interface we propose to four categories: Browsing/Shopping Items, order tracking, order status reporting, and online videos. With those different categories in mind, we interviewed 8 people.
All of our subjects were independent youngsters in their mid 20’s or early 30’s. We focussed on them mainly because of the understanding they have with respect to technology and also the current lifestyle of them. This is also where some of the most surprising responses were received.
Interviewees
U 01 is a graduate student who is an avid online shopper albeit not for kitchen products but in a general perspective. We thought she will make a very good subject because of her planning and executing the task to plan. Although she has a very good online presence, like purchasing online every 2 weeks she was not very enthusiastic about the idea of having a kitchen table top interface. Even if we forced her to have one her primary task of using it would be to look for recipe videos rather than using it as a tool for purchase and also not use more than a single device within a household.
U 02 is again an enthusiastic online shopper, enthusiastic cook and eager to use the kitchen top table interface. We approached this subject without any expectation but the potential impact this product may have on this subject itself was interesting. Two important things to be taken as reference from this interview was to have multiple interfaces within single household – reason attributed by the subject is each one can individually add to a single shopping cart thereby avoiding missing out on important items, and the recipe videos categorization based on cuisines for ease of selection.
U 03 is again a graduate student from RIT. He was an interesting subject we came across because he has had no history of buying products online and is never interested in doing so. The subject was very restricted in the kitchen too which goes by evidences like the user cooked rarely at home, relied more on purchasing ready made food. The subject also was not totally averse to online shopping since he used few sites to just browse through the products. The important thing we found out from this subject was his concern on security and the subject was in favour of multiple installations of the device as long as the security was not compromised. The subject at first did not catch the idea very well and it took some amount of time for the user to grasp the nuances of the product and state about how much he could actually afford for the product.
U 04 and U 05 is a interesting user because she lives in a small household and often needs to keep track of plenty of things, not limited to kitchen planning. Although she was not a very active home products shopper, she had a good understanding of online shopping experience and what a kitchen top table interface could potentially offer. Her preferences for the product were pretty normal. She preferred her iPad more rather than having a kitchen top interface although she was not against having it. Also she is one of our potential highest spender and was having a properly functional basic kitchen top table interface before adding enhanced functionality to the product
U 06 is an regular online shopper although not for kitchen items. The subject is a casual kitchen user with 5-6 hours dedicated for kitchen activities. Interesting takeaways from interviewing this user was having a audio enabled recipe videos although she currently is not a favourite of viewing recipe videos online. And of course she was excited about the idea of having a kitchen table top interface and was willing to spend a substantial amount on it, with the usual feature of sync across various devices.
U 07 is a graduate student at RIT. Even though she hails from India, she has experience cooking different cuisines and has a decent experience doing kitchen shopping. We thought Sofia would make a good user because of her knowledge of shopping products at the right time and asking for her suggestions how an online interface would improve her efficiency. Since she was not a big fan of online shopping of kitchen products, we asked her more about other aspects of the interface like watching recipe videos, dimensions which she prefers, cost factor, look and feel of the site and also some technology aspects related to mobile and interface sharing of data.
U 08 is a cooking enthusiast and by far the best subject we interviewed. She was excited about the prospect of having a kitchen table top interface and a frequent user of online shopping. Her preference for online shopping was restricted to purchasing appliances or necessary kitchen equipment rather than purchasing the actual groceries, which she preferred the conventional shopping way. Since she was a good cook, she was not enthusiastic of having a large number of recipes cluttering her display. She wanted to have recipes which an amateur cook can do like having the basic recipes. Two important points which she stressed was on having a device which is oil and heat resistant since people can just unintentionally go through a recipe again without bothering for a kitchen towel, and having a single interface per kitchen. This means she was basically against the workflow of multiple people doing many things and collating it to a single interface.
U 09 is a college student who is living independently with few of her friends. We thought Sania would make a interesting user since she was a modern user with a equal blend of cooking and online shopping. She had a very predictable online presence, to say in detail she could potentially purchase appliances if there were good discounts, otherwise for daily needs she was a conventional store shopper. Interesting things we could say about this interview was, she was in favour of having multiple interfaces within a single household with each potential user having separate accounts, the probability of which she attributed directly to the family. The other interesting aspect was she was more eager to have gas status in case the cooking mechanism was through LPG, having a communication mechanism attached to the device, and the only one who could spend the highest on this interface device!